

The Minister of Trade, Mr. Bandula Gunawardena recently stated that the Sri Lankan Government is contemplating introducing a system to regulate the online business platforms and bring some of them under its tax regime.
The digitalization of the economy and its rapid growth has been a key focus of tax debates in recent years and has been paired with policy debates about the taxes that digital companies pay and where they pay them. Digital service companies would often conduct business in one jurisdiction but recognize revenue and profits elsewhere, thereby not paying taxes within the jurisdiction where its business activity is conducted. In order to address this, several countries have introduced digital service taxes in an attempt to make digital businesses liable to pay tax in the jurisdiction where they engage in business operations.
Taxing digital activities affects many organizations as it overlaps with a range of taxes such as customs duties, VAT, income tax and sale and use taxes. The two most prevalent such taxes are specific DST (Digital Service Taxes) and VAT.


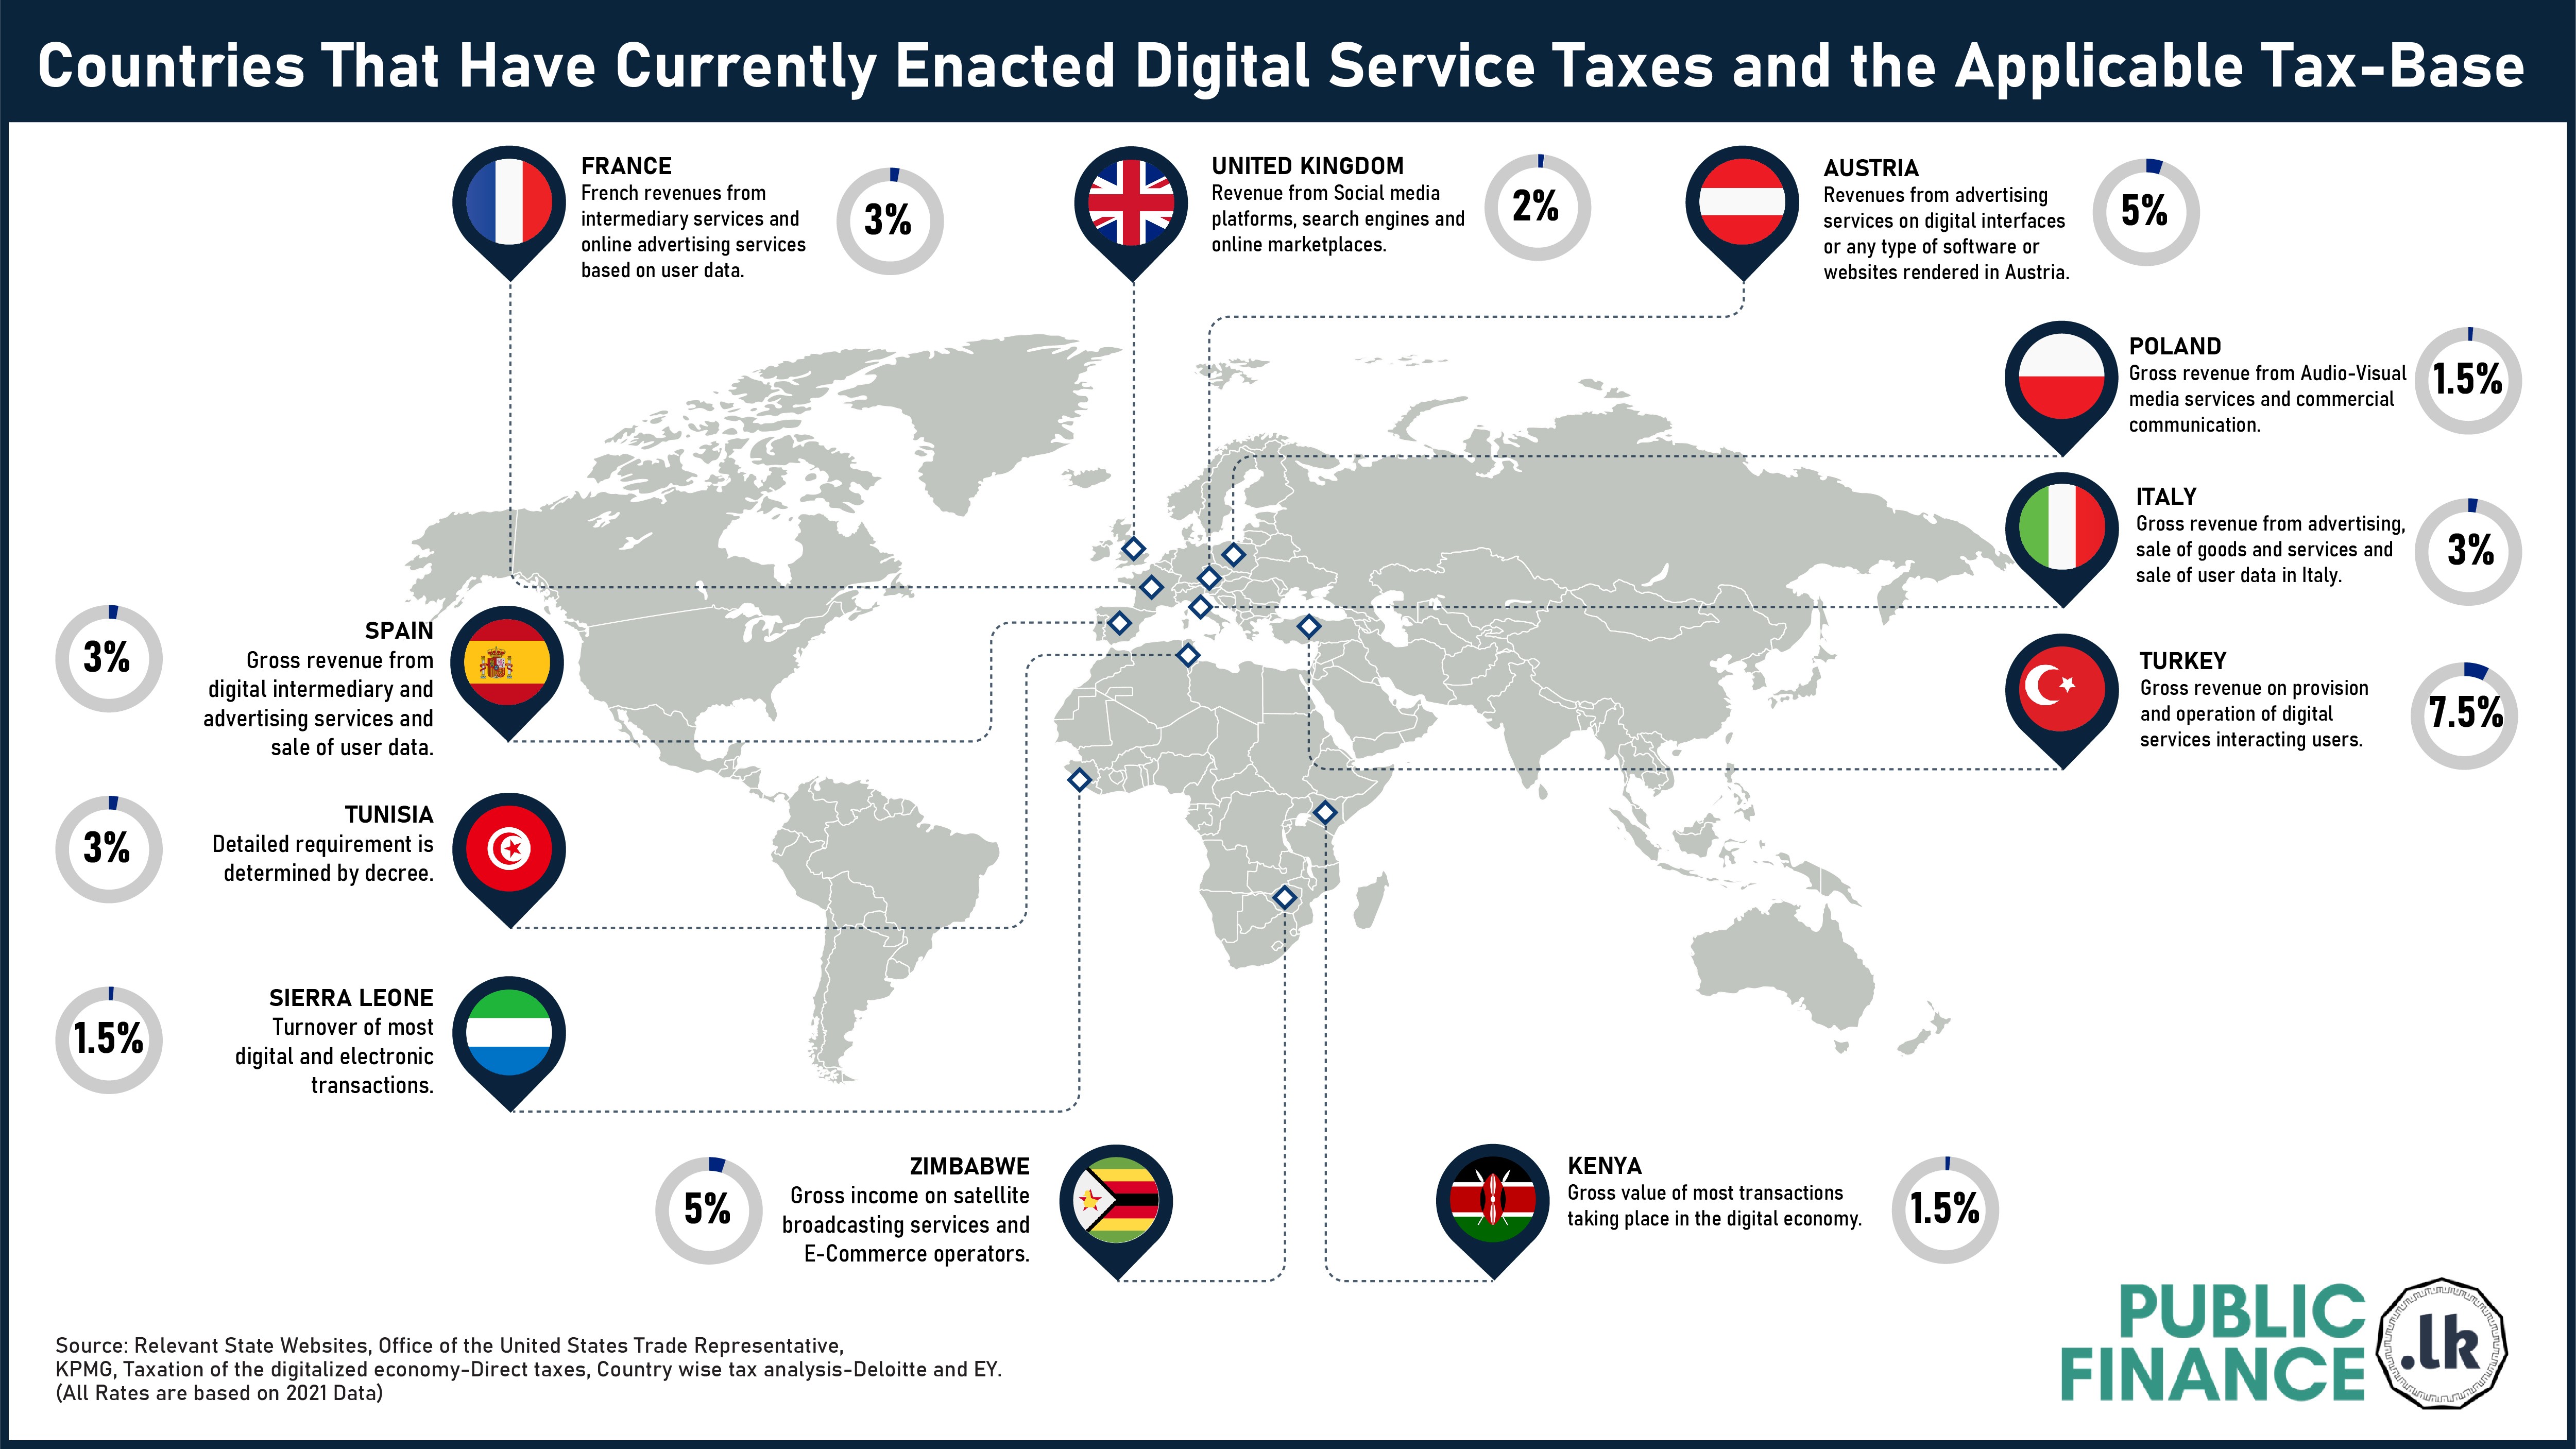
Digital services taxes are gross revenue taxes with a tax base that includes revenues derived from a specific set of digital goods or services or based on the number of digital users within a country.
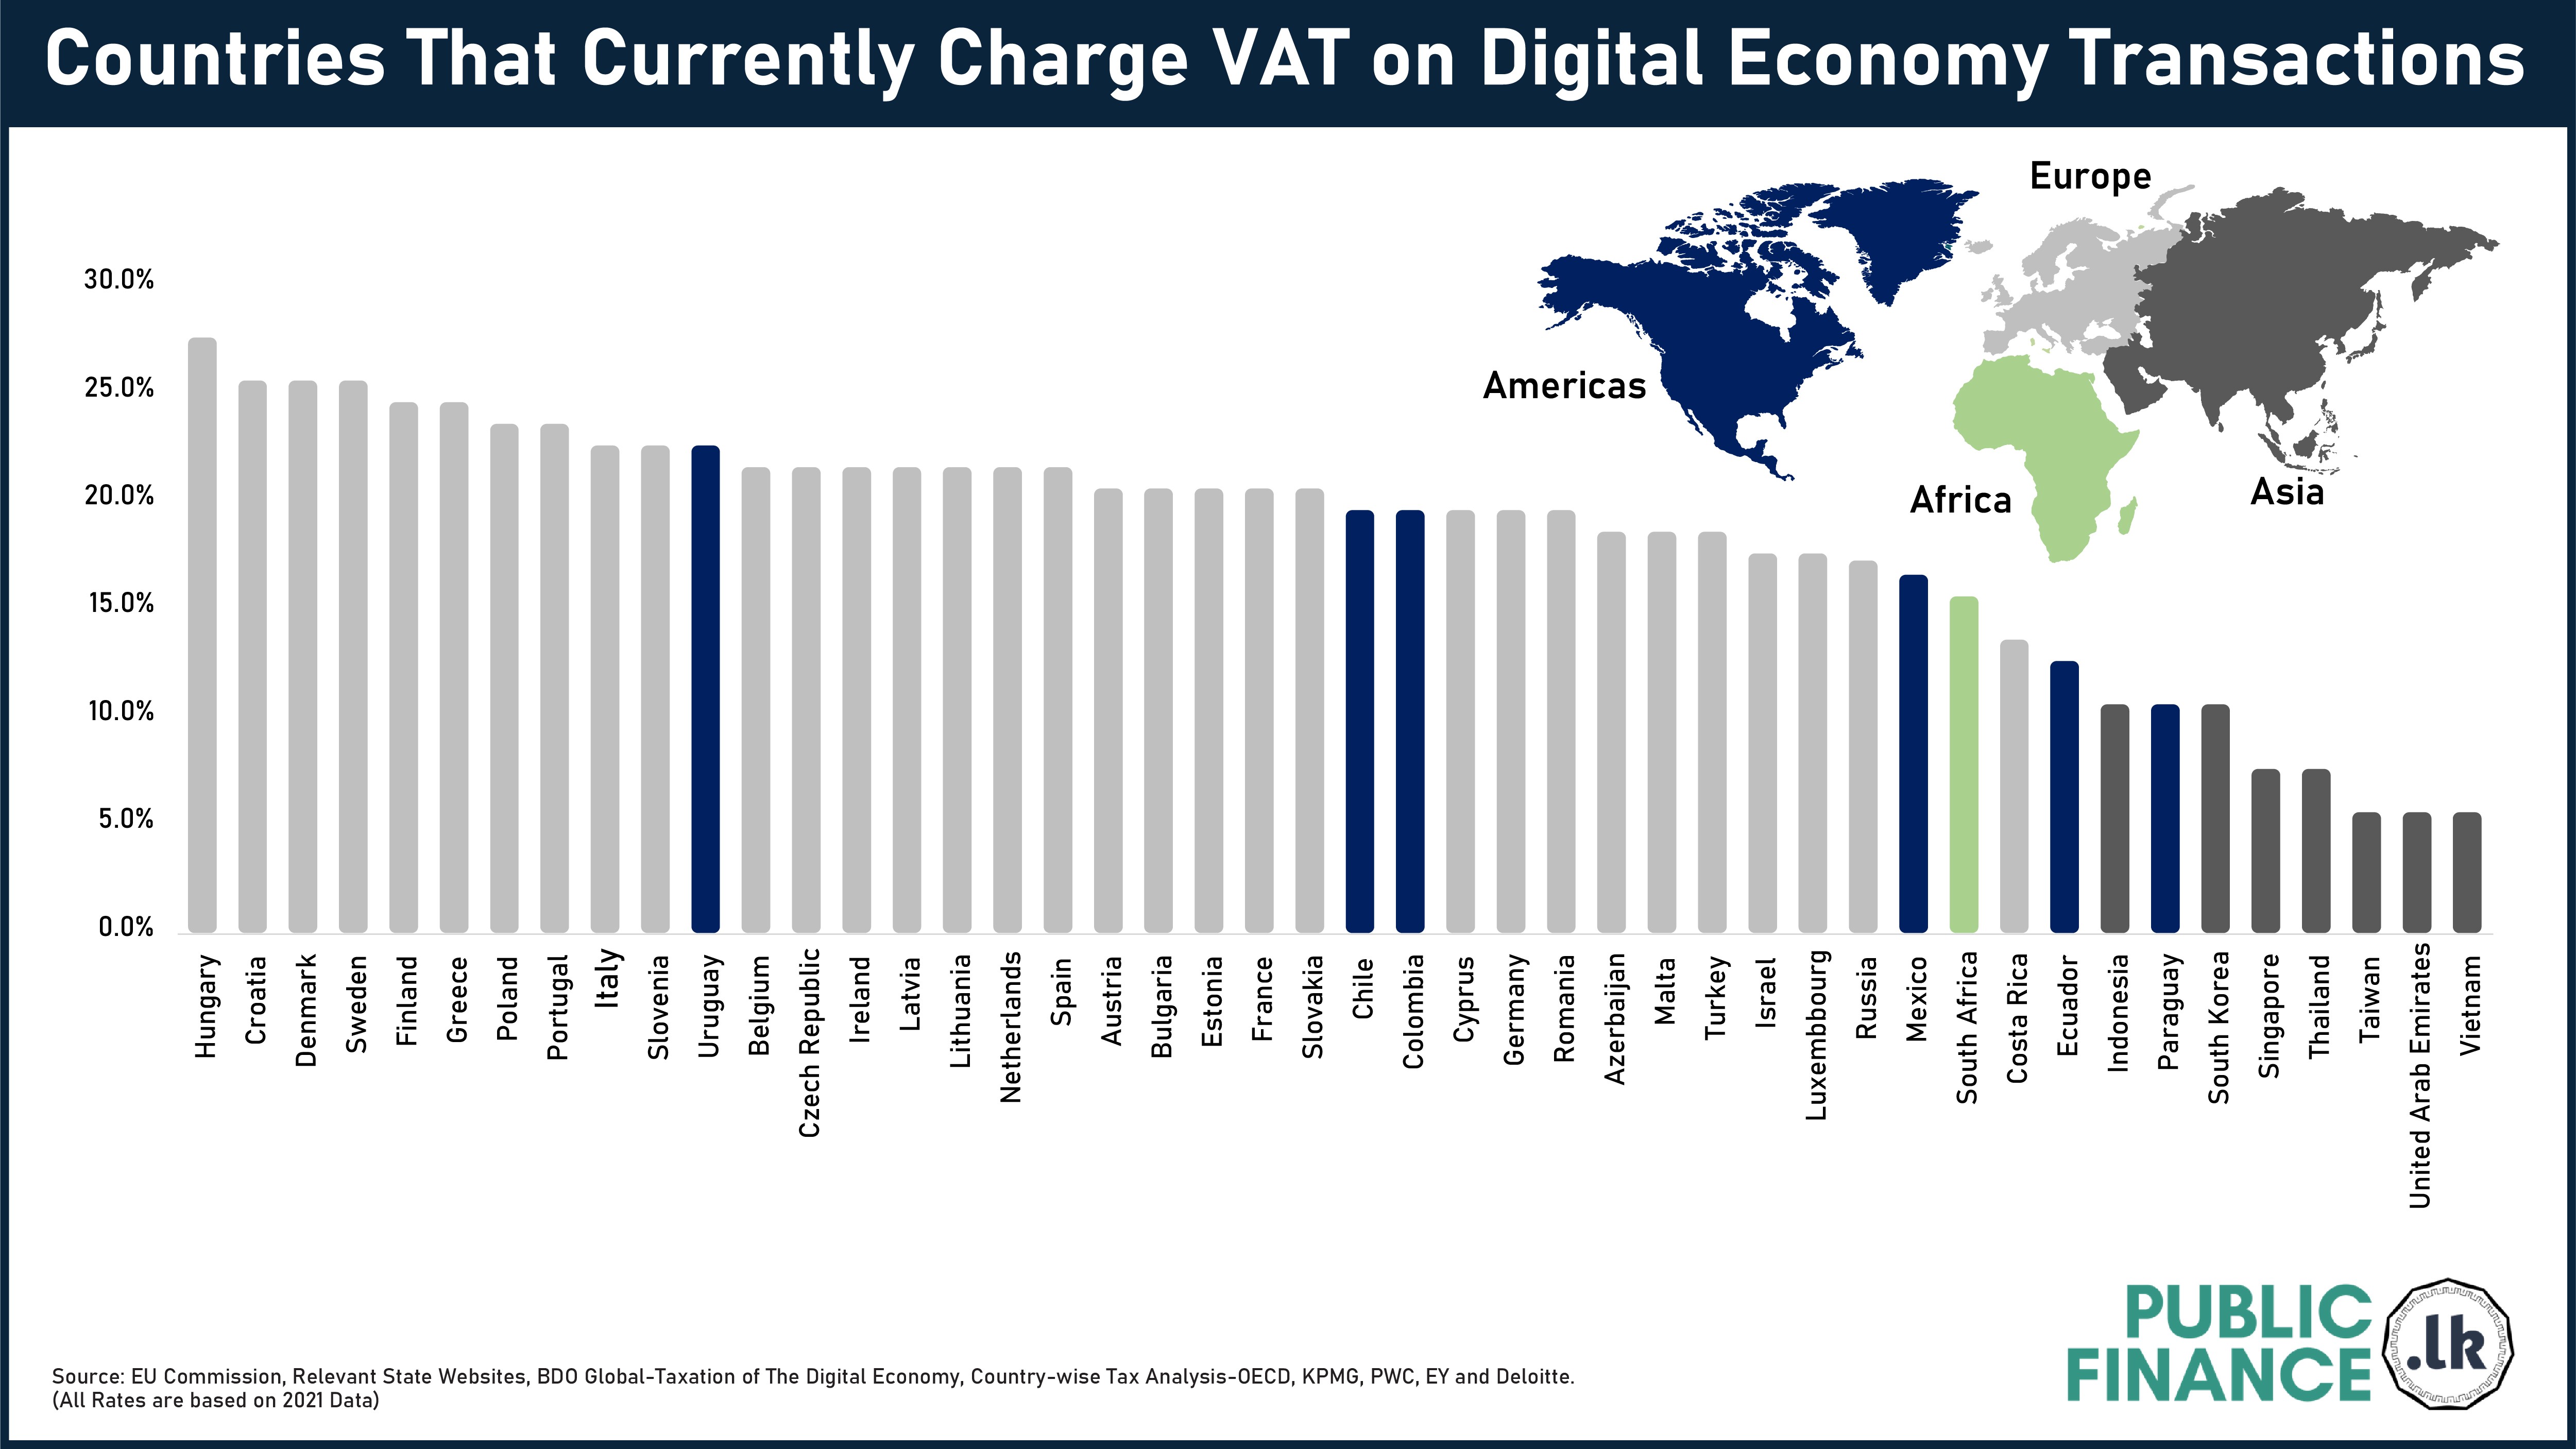
The following infographics illustrate the tax rates charged by countries which have currently enacted Digital Service Taxes along with the applicable tax base and countries imposing Value Added Taxes on the Digital Economy (Table 01 for more details).
Table 01
|
Country |
Rate |
Who does it apply to |
|
Hungary |
27.0% |
Non-resident companies with no local Permanent Establishment (PE), Non-resident companies with local PE, Resident Companies. |
|
Croatia |
25.0% |
Non-resident companies with no local PE, Non-resident companies with local PE, Resident Companies. |
|
Denmark |
25.0% |
Non-resident companies with no local PE, Non-resident companies with local PE, Resident Companies. |
|
Sweden |
25.0% |
Non-resident companies with no local PE, Non-resident companies with local PE, Resident Companies. |
|
Finland |
24.0% |
Non-resident companies with no local PE, Non-resident companies with local PE, Resident Companies. |
|
Greece |
24.0% |
Non-resident companies with no local PE, Non-resident companies with local PE, Resident Companies. |
|
Poland |
23.0% |
Non-resident companies with no local PE, Non-resident companies with local PE, Resident Companies. |
|
Portugal |
23.0% |
Non-resident companies with no local PE, Non-resident companies with local PE, Resident Companies. |
|
Italy |
22.0% |
Non-resident companies with no local PE, Non-resident companies with local PE, Resident Companies. |
|
Slovenia |
22.0% |
Non-resident companies with no local PE, Non-resident companies with local PE, Resident Companies. |
|
Uruguay |
22.0% |
Non-resident companies with a local PE. Resident individuals if they are CIT taxpayers |
|
Argentina |
21.0% |
Non-resident companies with no local PE |
|
Belgium |
21.0% |
Non-resident companies with no local PE, Non-resident companies with local PE, Resident Companies. |
|
Czech Republic |
21.0% |
Non-resident companies with no local PE, Non-resident companies with local PE, Resident Companies. |
|
Ireland |
21.0% |
Non-resident companies with no local PE, Non-resident companies with local PE, Resident Companies. |
|
Latvia |
21.0% |
Non-resident companies with no local PE, Non-resident companies with local PE, Resident Companies. |
|
Lithuania |
21.0% |
Non-resident companies with no local PE, Non-resident companies with local PE, Resident Companies. |
|
Netherlands |
21.0% |
Non-resident companies with no local PE, Non-resident companies with local PE, Resident Companies. |
|
Spain |
21.0% |
Non-resident companies with no local PE, Non-resident companies with local PE, Resident Companies. |
|
Austria |
20.0% |
Non-resident companies with no local PE, Non-resident companies with local PE, Resident Companies. |
|
Bulgaria |
20.0% |
Non-resident companies with no local PE, Non-resident companies with local PE, Resident Companies. |
|
Estonia |
20.0% |
Non-resident companies with no local PE, Non-resident companies with local PE, Resident Companies. |
|
France |
20.0% |
Resident platform users (entities and individuals). |
|
Slovakia |
20.0% |
Non-resident companies with no local PE, Non-resident companies with local PE, Resident Companies. |
|
Chile |
19.0% |
Non-Resident companies with no local PE |
|
Colombia |
19% |
Non-Resident companies with no local PE |
|
Cyprus |
19.0% |
Non-resident companies with no local PE, Non-resident companies with local PE, Resident Companies. |
|
Germany |
19.0% |
Non-resident companies with no local PE, Non-resident companies with local PE, Resident Companies. |
|
Romania |
19.0% |
Non-resident companies with no local PE, Non-resident companies with local PE, Resident Companies. |
|
Azerbaijan |
18.0% |
Citizens and civilians of the Azerbaijan Republic who are not registered in the Tax Authorities as taxpayers |
|
Malta |
18.0% |
Non-resident companies with no local PE, Non-resident companies with local PE, Resident Companies. |
|
Turkey |
18.0% |
Non-resident companies with no local PE. |
|
Israel |
17.0% |
A foreign entity deriving income from online transactions with Israeli residents |
|
Luxembourg |
17.0% |
Non-resident companies with no local PE, Non-resident companies with local PE, Resident Companies. |
|
Russia |
16.67% |
Non-resident companies with no local tax registered presence/branch/PE. |
|
Mexico |
16.0% |
Non-resident companies with no local PE, Non-resident companies with local PE, Resident Companies. |
|
South Africa |
15.0% |
Non-resident companies with no local PE. |
|
Costa Rica |
13% |
All non-resident companies providing cross border digital services |
|
Ecuador |
12.0% |
Non-Resident digital service providers |
|
Indonesia |
10.0% |
Overseas sellers |
|
Paraguay |
10.0% |
Non-resident companies or people |
|
South Korea |
10.0% |
Non-resident companies with no local PE. |
|
Singapore |
7.0% |
Companies belonging outside Singapore with no business establishment or fixed establishment in Singapore from a GST perspective |
|
Thailand |
7.0% |
Foreign businesses providing digital services in Thailand |
|
Taiwan |
5.0% |
Resident Companies, Non-resident companies with local PE |
|
United Arab Emirates |
5.0% |
All companies including non-resident companies with no local PE |
|
Vietnam |
5.0% |
Foreign Contractors |